With all the headlines and talk in the media about the shift in the housing market, you might be thinking this is a housing bubble. It’s only natural for those thoughts to creep in that make you think it could be a repeat of what took place in 2008. But the good news is, there’s concrete data to show why this is nothing like the last time.
There’s Still a Shortage of Homes on the Market Today, Not a Surplus
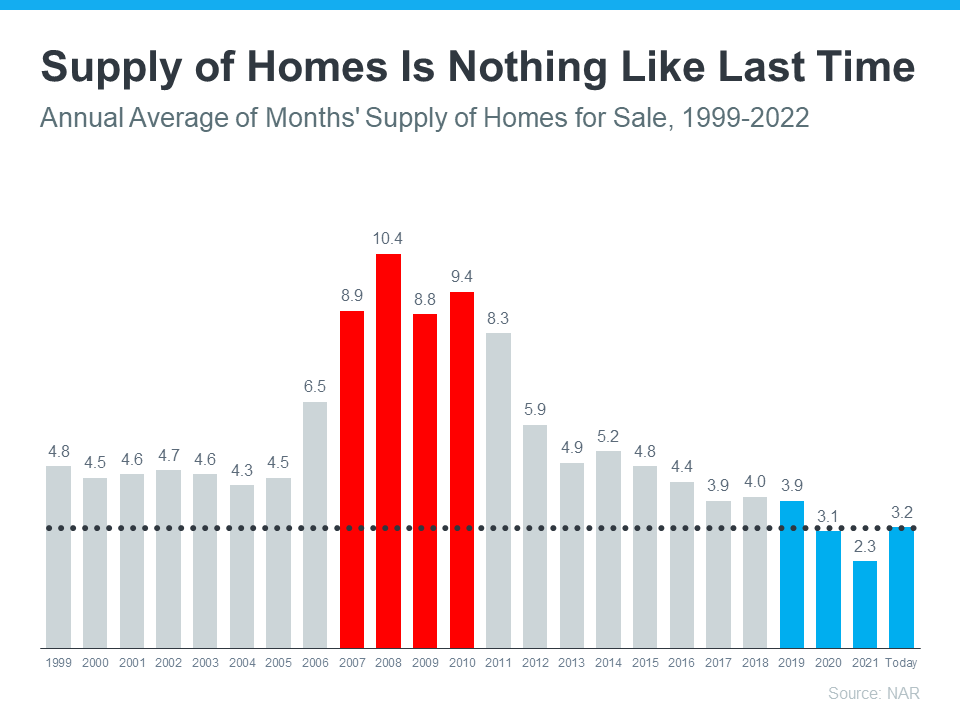
For historical context, there were too many homes for sale during the housing crisis (many of which were short sales and foreclosures), and that caused prices to fall dramatically. Supply has increased since the start of this year, but there’s still a shortage of inventory available overall, primarily due to almost 15 years of underbuilding homes.
The graph below uses data from the National Association of Realtors (NAR) to show how the months’ supply of homes available now compares to the crash. Today, unsold inventory sits at just a 3.2-months’ supply at the current sales pace, which is significantly lower than the last time. There just isn’t enough inventory on the market for home prices to come crashing down like they did last time, even though some overheated markets may experience slight declines.
Mortgage Standards Were Much More Relaxed Back Then
During the lead-up to the housing crisis, it was much easier to get a home loan than it is today. Running up to 2006, banks were creating artificial demand by lowering lending standards and making it easy for just about anyone to qualify for a home loan or refinance their current home.
Back then, lending institutions took on much greater risk in both the person and the mortgage products offered. That led to mass defaults, foreclosures, and falling prices. Today, things are different, and purchasers face much higher standards from mortgage companies.
The graph below uses Mortgage Credit Availability Index (MCAI) data from the Mortgage Bankers Association (MBA) to help tell this story. In that index, the higher the number, the easier it is to get a mortgage. The lower the number, the harder it is. In the latest report, the index fell by 5.4%, indicating standards are tightening.
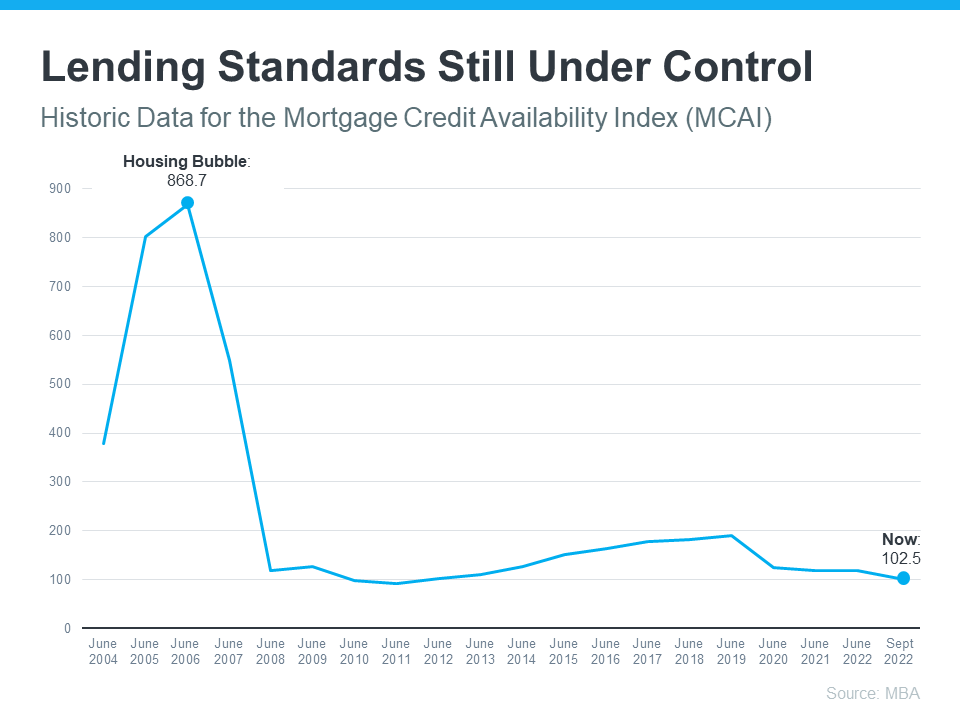
This graph also shows just how different things are today compared to the spike in credit availability leading up to the crash. Tighter lending standards over the past 14 years have helped prevent a scenario that would lead to a wave of foreclosures like the last time.
____________
If you’re concerned we’re making the same mistakes that led to the housing crash, the graphs above should help alleviate your fears. Concrete data and expert insights clearly show why this is nothing like the last time. If you have any other questions regarding today’s housing market or real estate in the DC Metro Area and anywhere else, feel free to reach out to me at 703-646-1750 / janet@simplyyourbestmove.com.